Written by Md Rakib Hassan — Income Tax Practitioner with 10+ years of tax compliance and audit experience across Bangladesh and the UK. Former Accounts Manager at a UK Chartered Accounting Firm managing 1,000+ clients. Currently Finance Controller at a UK-based multinational tech group.
Why Every Finance Professional in Bangladesh Must Master Excel for Financial Modeling
Whether you are a management accountant at a Dhaka-based corporate, an auditor working under the Institute of Chartered Accountants of Bangladesh (ICAB), or a finance officer at an NBR-registered entity — Excel for financial modeling is no longer optional. It is the single most important technical skill that separates entry-level number-crunchers from high-value finance professionals.
I have spent over a decade building financial models across Bangladesh and the UK — from preparing management accounts for clients at a London chartered accounting firm to building tax computation models for multinational groups. In every role, Excel has been the engine room.
This guide is based on The Ultimate Excel Handbook — a comprehensive resource published by the Financial Modeling World Cup (FMWC).
Let’s break it down into practical, actionable knowledge.
1. The Top 10 Excel Functions You Must Know for Financial Modeling
Excel for financial modeling starts with getting your functions right. The FMWC Handbook identifies ten core functions that form the backbone of any serious financial model.
SUMIFS — Far more powerful than SUMIF, it lets you sum data across multiple criteria simultaneously. In a tax computation worksheet, for instance, you can sum revenue by business unit and by accounting period in a single formula.
IFERROR — Every professional model must handle errors gracefully. IFERROR catches #N/A, #DIV/0!, #REF! and other error types, replacing them with a clean output. This matters enormously in Bangladesh NBR audit submissions where messy spreadsheets create audit flags.
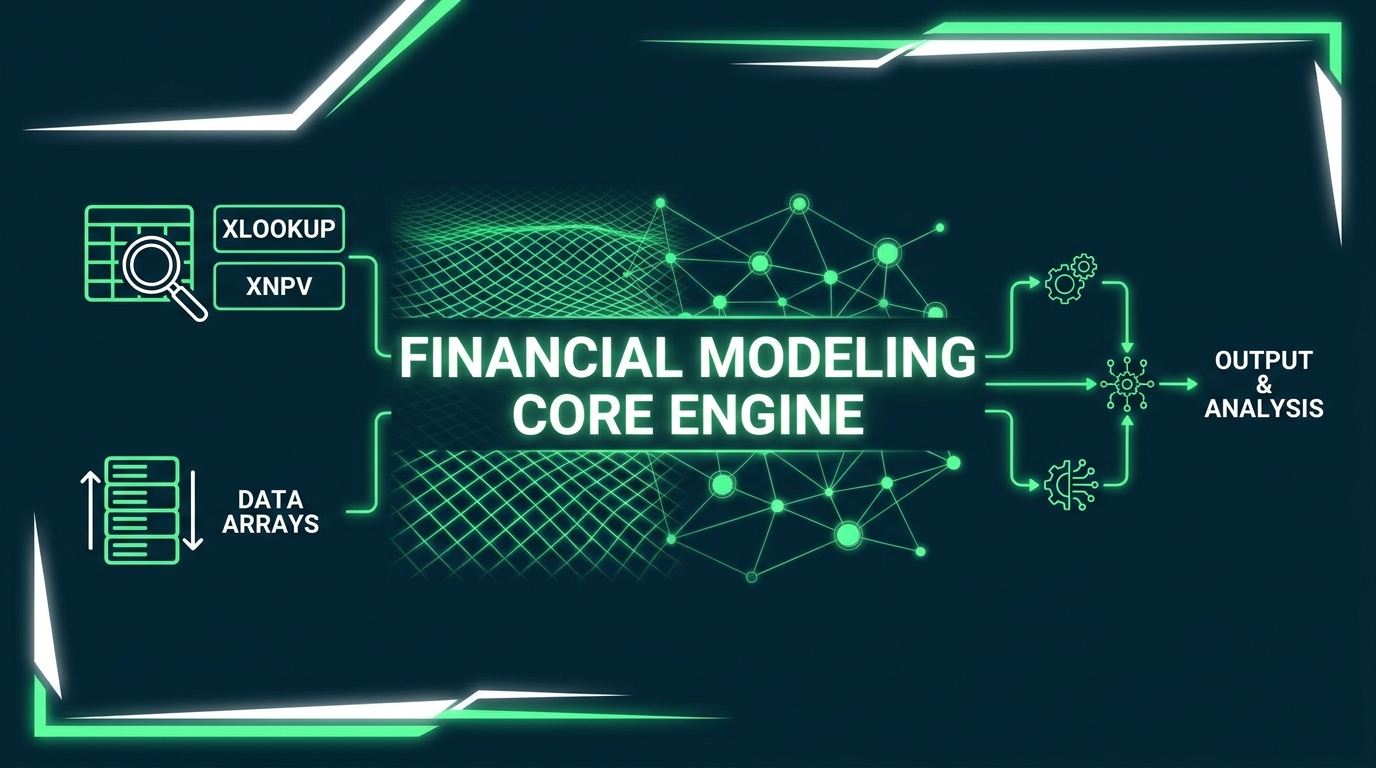
XIRR and XNPV — Unlike standard IRR and NPV, these two functions work with irregular cash flow intervals — essential for investment appraisals, project feasibility analysis, and business valuations in the Bangladesh market where cash flows are rarely uniform.
PMT, PPMT and IPMT — Loan amortisation schedule construction is a daily task for finance teams. These three functions handle mortgage and term loan repayment modelling with precision.
SLOPE — Used widely in investment banking and equity analysis, SLOPE calculates the Beta of a stock by comparing returns against a benchmark index. With Bangladesh’s capital market (DSEX) growing, this function is increasingly relevant for fund managers and analysts.
XLOOKUP — The modern replacement for VLOOKUP. Faster, more flexible, and capable of returning results from any direction. If you are still using VLOOKUP in 2026, it is time to upgrade.
INDEX & MATCH — When XLOOKUP reaches its limits (single-array comparisons), INDEX combined with MATCH provides true two-dimensional lookup capability across entire tables.
EOMONTH — Calculates the last day of any given month. Indispensable for setting up financial model timelines, calculating loan maturity dates, and building compliance calendars aligned with NBR tax filing deadlines.
SEQUENCE — Generates large arrays of sequential numbers instantly. Essential for timeline construction in multi-year financial forecasts.
Mastering these ten functions alone will elevate the quality of your Excel for financial modeling work dramatically.
2. Text Splitting Functions — Underused but Extremely Powerful
Finance professionals often work with messy imported data — from bank statements, ERP exports, or government portals. The FMWC Handbook covers four text-handling tools that make data cleaning fast:
Text to Columns (Alt + A + E) — Splits cell content using a delimiter like a comma, space, or pipe character. Ideal for processing raw data downloads from the NBR iBAS++ system or bank feeds.
LEFT / RIGHT / MID — Extract specific characters from any position in a cell. Useful for isolating TIN numbers, bank account codes, or currency prefixes from combined fields.
TEXTAFTER / TEXTBEFORE — More intelligent than LEFT/RIGHT, these functions extract text based on a delimiter word or character rather than a fixed position.
TEXTSPLIT — The most powerful of the group. It splits an entire string into rows or columns based on specified delimiters, significantly reducing manual data preparation time.
Flash Fill (Ctrl + E) — Uses AI-like pattern recognition to replicate a transformation across a column. What might take 30 minutes manually takes under 10 seconds with Flash Fill.
3. Conditional Formatting and Depreciation Methods in Excel
A well-structured Excel financial model is not just accurate — it is readable. Conditional formatting turns raw numbers into visual intelligence. Use colour scales to spot anomalies in a large dataset, highlight cells that breach a threshold, or flag overdue receivables in an accounts ageing report.
The FMWC Handbook also provides a detailed breakdown of depreciation methods you need to model correctly in Bangladesh under BFRS and in the UK under FRS 102:
- Straight-Line Method — Cost divided by useful life. Equal charge each year. The most common approach for NBR tax depreciation schedules.
- Declining Balance — Higher charges in earlier years. Applied to assets that depreciate rapidly with use.
- Double Declining Balance — Doubles the rate of declining balance. Reflects heavier early-year productivity.
- Sum-of-the-Years-Digits (SYD) — An accelerated method that applies a decreasing fraction of cost over the asset’s life.
- MACRS — The Modified Accelerated Cost Recovery System, primarily used in US-standard reporting environments.
- Service Hour Method — Charges depreciation based on actual hours of use. Common for transport vehicles in Bangladesh where running time varies significantly.
Having each of these built as reusable Excel templates saves enormous time during audit preparation and statutory accounts production.
4. Data Tables, Pivot Tables, and What-If Analysis
Excel for financial modeling lives on scenario analysis. The Data Table feature (accessed via Data → What-If Analysis → Data Table) is one of the most underutilised tools in Bangladesh’s finance community.
A Data Table lets you test hundreds of input combinations — for example, how a company’s loan repayment changes across different interest rates and principal amounts — and display every result in a single matrix. This is the foundation of professional sensitivity analysis in any financial model.
PivotTables take this further. A PivotTable can summarise millions of rows of transactional data into a management-ready report in seconds. The FMWC Handbook shows how to build PivotTables with slicers, timelines, and dynamic subtotals — features every financial controller should be using daily.
5. Data Validation — Building Error-Proof Financial Models
A financial model is only as reliable as the inputs fed into it. Data Validation allows you to restrict what can be entered into any cell — numbers only, dates within a range, selections from a dropdown list.
The practical application for Bangladeshi finance teams is significant: you can build a model where a user selects a cost centre or business unit from a dropdown, and the entire Profit & Loss statement automatically updates. This eliminates manual input errors that regularly cause discrepancies in management accounts and tax returns.
6. Group Data, Power Query, and Mastering Large Datasets
Any serious practitioner working in Excel for financial modeling will at some point face datasets containing tens or hundreds of thousands of rows — payroll data, sales transactions, VAT return source data, or NBR customs records.
Group Data (Data → Group → Group) allows you to create collapsible row and column hierarchies. A CFO sees Level 1 summary figures; the accountant drills to Level 4 transaction detail. This eliminates the amateur practice of simply hiding rows and columns.
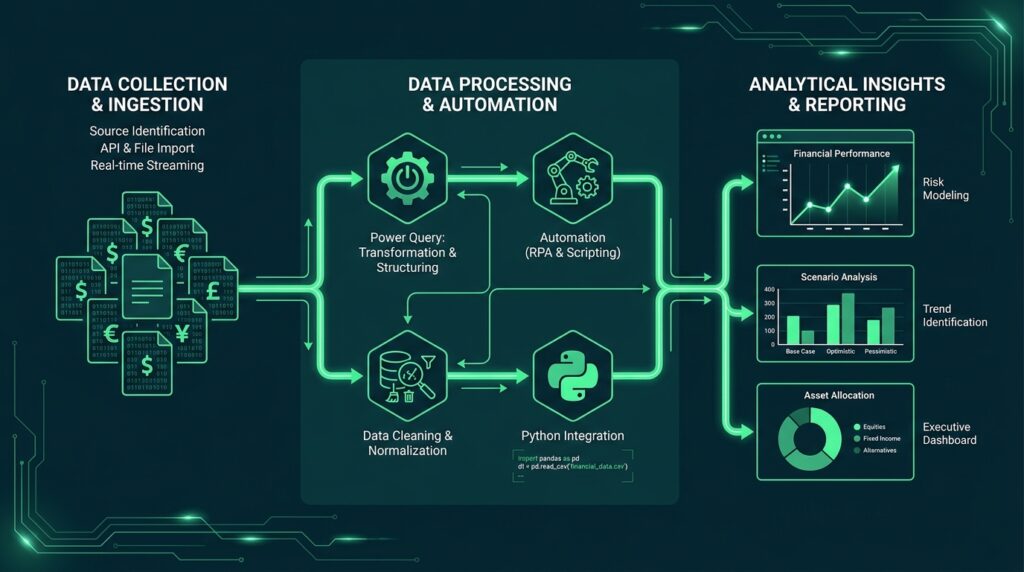
Power Query (known as Get & Transform in Excel) is a game-changer for large data work. It allows you to:
- Connect to external data sources including other workbooks, databases, and web feeds
- Transform and clean data using a recorded, repeatable set of steps
- Merge and append datasets from multiple sources
- Automate monthly data refresh with a single click
The FMWC guide on mastering large datasets recommends using Power Query alongside PivotTables and a properly structured Data Model to handle over one million rows without performance degradation — a real challenge in Bangladesh when processing full-year payroll registers or consolidated group accounts.
7. Excel Shortcuts Every Finance Professional Should Know
Time is the scarcest resource in any finance department. The FMWC Handbook includes a comprehensive shortcuts reference covering General, Navigation, Workbook, and Formatting categories. Key ones for finance professionals include:
- Ctrl + E — Flash Fill
- Ctrl + Shift + $ — Currency Format
- Ctrl + Shift + # — Date Format
- Alt + D, T — Data Table
- Ctrl + Z / Y — Undo / Redo
- Ctrl + Shift + L — Apply/Remove Auto-filter
- Shift + F11 — Insert New Worksheet
A finance professional who commands keyboard shortcuts can build the same financial model in half the time compared to someone who works exclusively with a mouse.
8. Python in Excel — The Future of Financial Analysis
The FMWC Handbook dedicates a full chapter to Python integration in Excel, and for good reason. The =PY() function (available in Microsoft 365) brings the full power of Python libraries — pandas, statsmodels, Matplotlib, Seaborn — directly into your spreadsheet.
This means Bangladeshi finance professionals and data analysts can now:
- Build pandas DataFrames directly from Excel tables
- Perform statistical analysis including regression and descriptive statistics
- Generate advanced data visualisations (box plots, scatter plots, heatmaps) inside Excel
- Run K-Means clustering for customer segmentation or cost grouping
This is no longer the exclusive territory of data scientists. Excel for financial modeling is evolving rapidly, and those who adapt early will have a significant career advantage.
9. How ChatGPT Can Enhance Your Excel Workflow
AI is reshaping finance work at every level. The FMWC Handbook highlights three practical use cases for combining ChatGPT with Excel:
Generating VBA Macros — Describe what you need in plain language and ChatGPT produces a working VBA macro. Excel MVP Kevin Stratvert demonstrated this by generating an invoicing automation macro using nothing but a text prompt.
Simplifying Complex Formulas — If you have a nested IF formula that has grown unwieldy, ChatGPT can simplify it (for example, replacing =IF(G7>0,G7,0) with =MAX(G7,0)).
Writing Power Query M Code — Ask ChatGPT to write M code that appends two workbook sheets and removes duplicates, and it produces a working, annotated solution in seconds.
Always verify AI-generated outputs before using them in client-facing or regulatory submissions.
10. The History of Microsoft Excel — From 1985 to 2026
Excel was first launched on Mac in 1985. It reached Windows in 1987 as Excel 2.0. Key milestones include VBA introduction in 1993 (Excel 5.0), the Ribbon interface in 2007, Power Query in 2010, dynamic arrays in 2018, and LAMBDA/LET functions in 2021. The IMAGE function followed in 2023, with Microsoft Copilot for Excel now reshaping how finance professionals interact with their spreadsheets entirely.
Understanding this evolution matters: features like Power Query, XLOOKUP, and dynamic arrays are only available from certain Excel versions onwards. In Bangladesh, where many organisations still run older Microsoft Office versions, knowing which features your environment supports is critical before designing any model.
Final Thoughts
Excel for financial modeling remains the single most transferable and high-value technical skill in the finance profession — whether you are operating in Dhaka, Chittagong, London, or anywhere else. The tools covered in this guide — from SUMIFS and XLOOKUP to Power Query, Python integration, and AI-assisted formula writing — are not theoretical. They are in active daily use by finance controllers, auditors, investment analysts, and tax practitioners around the world.
If you are serious about advancing your finance career in Bangladesh, start here. Build the habits. Learn the shortcuts. Master the formulas. The investment in time will pay dividends for your entire career.
For queries on tax compliance, financial modelling, or accounting support in Bangladesh or the UK, connect with Md Rakib Hassan via this platform.
Leave a Reply
You must be logged in to post a comment.