Why is financial data visualization important for businesses? Financial data visualization transforms thousands of rows of dense accounting data into clear, easy-to-read charts and dashboards. For CEOs and business owners in Bangladesh, this visual approach highlights cash flow trends, budget variances, and Key Performance Indicators (KPIs) instantly, allowing for rapid, data-driven decision-making without needing to read complex spreadsheets.
Turning Data into Decisions: Financial Data Visualization in Bangladesh
For many business owners in Dhaka, Sylhet, and across Bangladesh, the end-of-month financial meeting is a source of frustration. Traditional accountants often hand over massive, multi-page spreadsheets filled with thousands of rows of raw data. While this data might be perfectly accurate for National Board of Revenue (NBR) compliance, it is essentially useless for a CEO who needs to make a strategic decision in the next five minutes.
In modern business, data is only valuable if it can be understood immediately. As a finance manager overseeing multi-national operations, I specialize in Data Analysis and Visualization. I transform raw, complex numbers into clear, actionable business intelligence. This guide explains why upgrading from static spreadsheets to dynamic financial dashboards is crucial for scaling your company in 2026.
The Problem with Traditional Spreadsheets
Spreadsheets are excellent tools for storing data, but they are terrible tools for communicating a story. When you manage a portfolio of clients or a group of multi-national companies, the sheer volume of data is overwhelming.
If a business owner has to spend an hour hunting through a spreadsheet just to figure out if their Accounts Receivable is growing faster than their cash reserves, the accounting department is failing them. Furthermore, static spreadsheets do not update in real-time. By the time leadership reviews the data, the market conditions or cash flow realities may have already shifted.
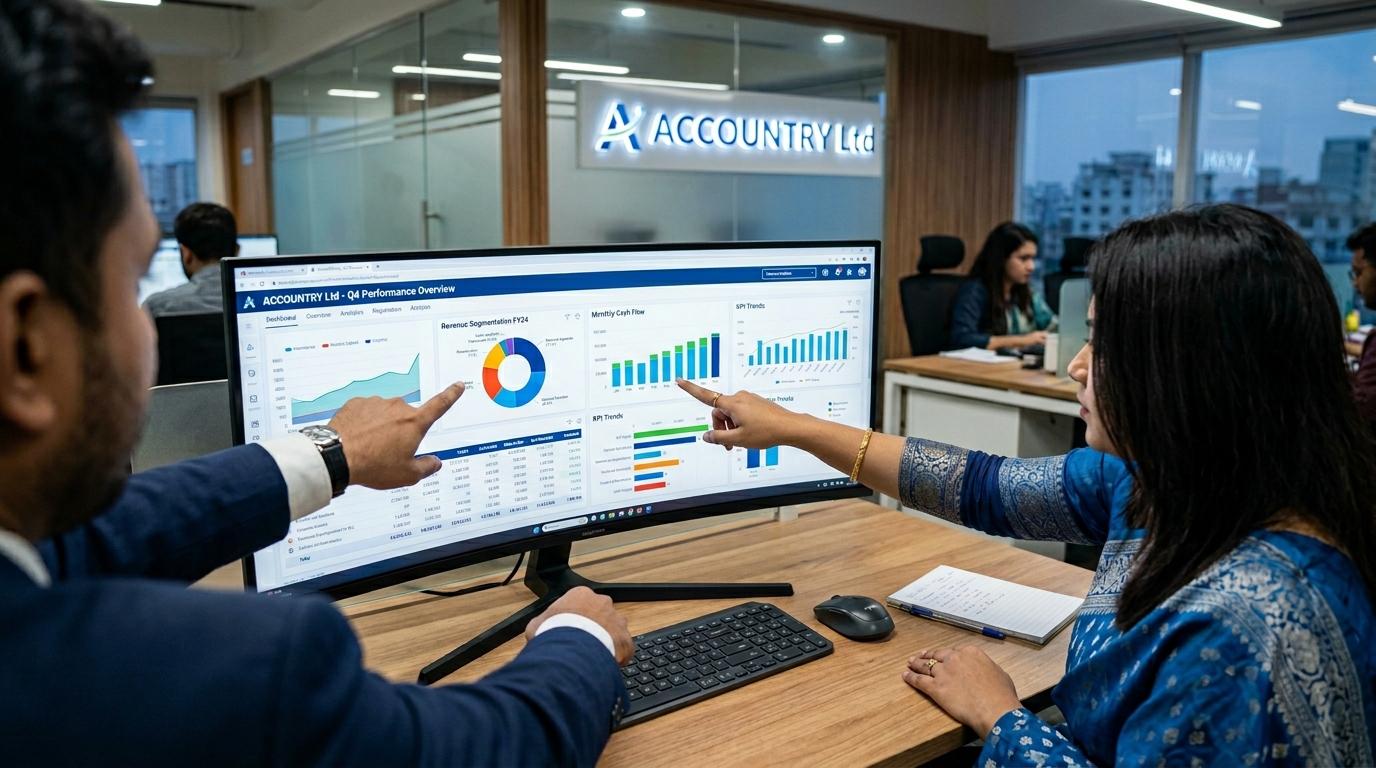
The Power of Real-Time Dashboards
Financial data visualization solves this by creating a centralized “Command Center” for your business. Instead of raw numbers, leadership views dynamic charts, graphs, and visual indicators.
By utilizing advanced tools, including cloud accounting software and Google Sheet Appscript, a skilled finance professional can build custom project dashboards. These dashboards automatically pull data from your bank accounts, payment gateways, and payroll systems. When a CEO logs in, they immediately see their Gross Profit Margin, burn rate, and current cash runway presented in a clean, visual format.
Custom KPIs for Bangladeshi Businesses
Every business model is unique, which means the metrics you track must be customized. An e-commerce brand needs entirely different visual data than a B2B tech agency.
I actively assist CFOs and top leadership with complex budgeting and forecasting by building dashboards that track specific Key Performance Indicators (KPIs). For example, if a company is struggling with resource capacity, we build visual trackers for team leader assignments and individual member work hours, adjusting the logic for standard 5-day or 6-day work weeks in Bangladesh.
Visual Data vs. Raw Data
| Analytical Need | Raw Spreadsheet Data | Visual Dashboard |
|---|---|---|
| Trend Spotting | Requires manual calculation line-by-line | Instantly visible on a line graph |
| Budget Variance | Comparing two separate columns of text | Color-coded alerts (Red = Over budget, Green = Safe) |
| Speed of Insight | Takes hours to decipher | Takes seconds to understand |
| Presentation | Boring, dense, and difficult to share | Highly professional and pitch-ready for investors |
Export to Sheets
Ensuring Professional Reporting Quality
When presenting data visually, the technical rendering must be flawless. Whether you are generating an internal dashboard or exporting a PDF report for a board meeting, the formatting matters. I ensure that all technical aspects are resolved—from ensuring CSS background patterns appear correctly in A4 PDF exports to keeping conversational email text strictly outside of formal financial documents. Clean, professional presentation reflects the integrity of the data itself.
Conclusion
Your financial data should act as a compass, not an anchor. If your current accounting systems are burying you in unreadable spreadsheets, you are severely limiting your company’s agility. By implementing high-level financial data visualization and custom dashboards, you empower your leadership team to make fast, accurate, and highly profitable decisions. If your business in Bangladesh is ready to turn its raw data into a strategic advantage, contact me today to start building your custom financial dashboard.
Frequently Asked Questions (FAQs)
- What tools are used for financial data visualization?
Depending on the business size, we use built-in analytics from platforms like Xero and QuickBooks, or we build highly customized dashboards using Google Data Studio, Microsoft Power BI, and Google Apps Script integrations. - Can a dashboard track multi-currency operations?
Yes. If your company operates in the UK, Canada, and Bangladesh, a well-designed dashboard will automatically convert global revenue streams into a single unified currency for easy, real-time comparison. - How often does a visual dashboard update?
Unlike monthly static reports, cloud-connected dashboards can update daily or even hourly, depending on how frequently your payment APIs and bank feeds push new data into the system.